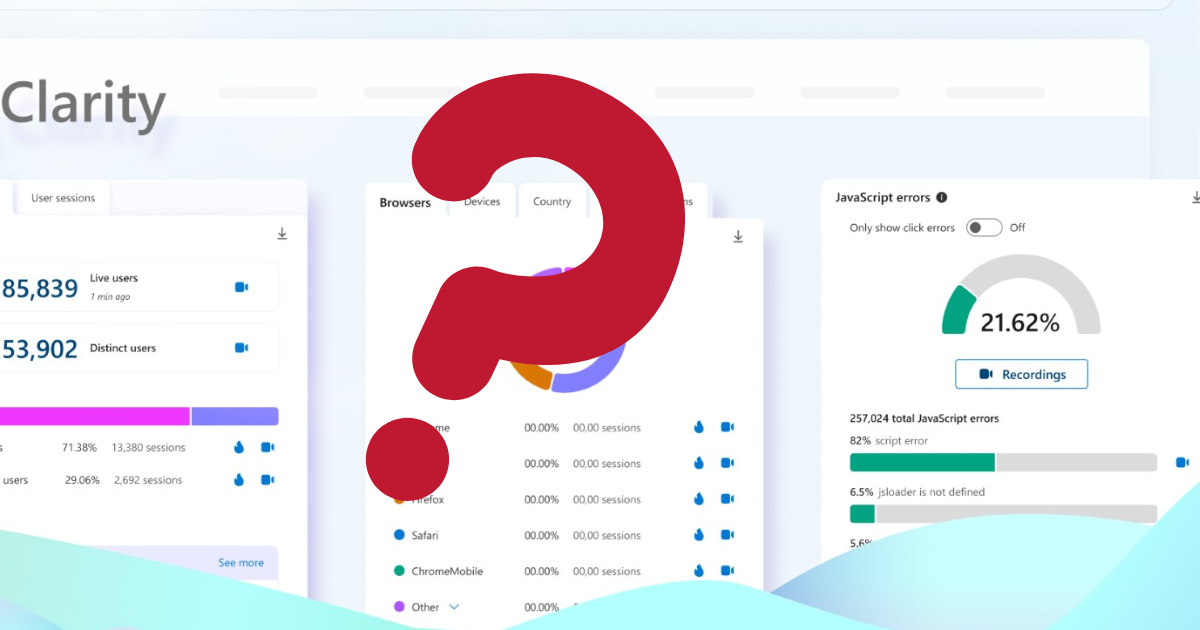
I want to share one of my absolute favorite new tools for navigating the digital marketing world right now….because the fact is, we can no longer measure success entirely by old school search engine rankings, CTR’s, and static page views. We are operating in a hybrid ecosystem now, where human behavioral analytics and machine data retrieval are equally important. Because of this, Microsoft Clarity has quickly become a staple in my workflow. It has expanded well beyond basic UX analytics into a platform with incredible AI Visibility features that help us understand exactly how our content appears in AI generated answers.
The best part is that Clarity’s core analytics platform remains free and includes access to its AI Visibility capabilities. It provides an unsampled look at exactly how human users navigate a site, paired with visibility into citation and grounding data from Microsoft AI experiences.
Here is a breakdown of Microsoft Clarity’s feature set in 2026, how each function works, and my absolute favorite ways to use this tool in my daily strategy. Read on if you’re truly looking to be amazed. Did I mention this costs nada?
Favorite Feature #1: Session Recordings
What it does: Session recordings capture the exact journey a user takes on your website. Clarity records mouse movements, clicks, scrolling behavior, and navigation paths across your pages. Unlike older analytics platforms that just hand you a spreadsheet of bounce rates, session recordings provide a video like playback of the user’s screen experience. Privacy is baked right in; Clarity automatically masks sensitive user data like keystrokes, passwords, and personal identifiable information before the recording is ever processed.
My Favorite Way to Use It: Diagnosing Checkout Abandonment If I am running a high spend Google Ads campaign and GA4 shows a massive 45% drop off at the final shipping calculation step, I do not just guess what went wrong. I filter my Clarity session recordings to show only the users who reached the /checkout/shipping URL but did not make it to the /thank you page. Watching these specific sessions usually reveals the culprit, like mobile users attempting to tap a poorly coded “Calculate Rates” button that sits too close to the edge of the screen. I can send that recording directly to the development team, and the fix increases the conversion rate overnight.
Favorite Feature #2: Heatmaps (Click, Scroll, and Area)
What it does: Heatmaps aggregate the behavioral data of thousands of users into a single, color coded visual overlay on your web pages.
- Click Heatmaps show exactly where users are tapping or clicking (the “hotter” the color, the more interaction).
- Scroll Heatmaps show how far down a page the average user navigates before leaving.
- Area Heatmaps allow you to select specific modules or blocks of a page to see the total percentage of clicks that occurred within that defined boundary.
My Favorite Way to Use It: Landing Page Restructuring When my content team writes a comprehensive, 3,000 word buyer’s guide that ranks well but has a terrible conversion rate, the Scroll Heatmap is my best friend. I often discover that 80% of readers abandon the page before reaching the 50% scroll mark, which happens to be exactly where the primary call to action lives. I use this data to restructure the page, pulling the CTA up above the fold and breaking the text into an accordion style layout. The Click Heatmap is also great for catching users repeatedly clicking on a static product image expecting it to enlarge, signaling that we need to swap it for a gallery lightbox.
Favorite Feature #3: Behavioral Frustration Metrics
What it does: Clarity uses machine learning algorithms to automatically detect and categorize user frustration. It isolates specific sessions where the user interface is failing the human being on the other side of the screen.
- Rage Clicks: When a user repeatedly and rapidly clicks on the same element within a few seconds.
- Dead Clicks: When a user clicks on an element that looks interactive (like an image or highlighted text) but nothing happens.
- Quick Backs: When a user clicks a link to a new page, but immediately hits the back button, signaling the destination was irrelevant or broken.
My Favorite Way to Use It: Post Launch Quality Assurance Whenever we launch a massive site redesign, I do not wait for angry customer service emails to trickle in about broken features. I immediately jump into the Clarity dashboard and filter the traffic by “Dead Clicks” and “Rage Clicks.” It is the fastest way to identify things like a custom dropdown menu freezing on Safari browsers. Finding friction proactively lets us mitigate revenue loss and push a patch within hours of the launch.
Favorite Feature #4: Google Analytics Integration
What it does: Clarity allows you to seamlessly connect your Google Analytics 4 (GA4) property directly to the platform. While GA4 is excellent at answering what happened, it is historically terrible at answering why. This integration passes a Clarity session URL back into your GA4 events, allowing you to bridge the gap between quantitative metrics and qualitative observation.
My Favorite Way to Use It: Investigating Ad Spend Inefficiencies If I notice in GA4 that a specific demographic coming from a LinkedIn ad campaign has an unusually high bounce rate compared to organic traffic, I build a segment for that exact ad traffic. Because of the integration, I can click a link that takes me straight to the corresponding Microsoft Clarity session recordings for those specific users. This usually uncovers a messaging mismatch, like the ad implying a free software trial while the landing page demands a credit card upfront. The qualitative video proves what the spreadsheet could only hint at.
Favorite Feature #5: Copilot in Clarity (AI Session Summaries)
What it does: Watching thousands of session recordings is a massive drain on resources. Microsoft integrated its Copilot generative AI directly into Clarity to watch the sessions for you and provide concise, natural language summaries of user behavior. It can aggregate takeaways from multiple sessions, highlighting friction points and successful conversions without requiring a human to sit through hours of footage.
My Favorite Way to Use It: Rapid Reporting for Stakeholders When I am preparing for a monthly marketing review and the executive team wants to know how the new pricing page is performing, I do not manually review 50 individual sessions. I just use Copilot to generate a summary of all user sessions on the /pricing URL. It outputs a clean, bulleted list stating things like: “Users spend an average of 45 seconds comparing the Pro and Enterprise tiers, frequently hovering over the ‘API Access’ tooltip, but 30% experience a dead click when trying to expand the FAQ section.” I drop that exact summary straight into my presentation deck.
Favorite Feature #6: Citations & Share of Authority
What it does: As search shifts from traditional link clicking to generative answers, Clarity introduced AI Visibility metrics. The Citations dashboard tracks exactly how often your specific web pages are referenced as source material in AI generated answers. More importantly, it calculates your “Share of Authority”, a competitive metric that compares your citation presence against competing domains across Microsoft AI experiences and supported AI visibility datasets.
My Favorite Way to Use It: Measuring GEO ROI When my agency spends a quarter optimizing a client’s content for AI retrieval, traditional organic traffic naturally declines due to zero click AI answers. When the client panics, I use the Share of Authority dashboard to prove that while raw clicks are down, the brand now commands a 65% Share of Authority in AI answers for their core product category, compared to their main competitor’s 12%. It is the perfect feature for pivoting KPIs away from raw traffic and toward ecosystem influence.
Favorite Feature #7: Grounding Queries
What it does: When a human types a messy, conversational prompt into an AI assistant, AI systems often generate one or more grounding queries that may differ from the user’s original prompt to retrieve factual data from indexers. Clarity reveals these exact machine translated grounding queries that successfully triggered your content to be cited across Microsoft’s supported experiences.
My Favorite Way to Use It: Reverse Engineering AI Intent If I am trying to rank for queries related to “supply chain software,” traditional tools only show what humans type. However, Clarity’s Grounding Queries feature might reveal that when the AI builds an answer, it translates the intent into: “supply chain software ERP integration compliance standards 2026.” Realizing the machine prioritizes data on compliance and integration over general feature lists allows me to update our content strategy to mirror this machine syntax, ensuring our pages are structured exactly how the AI attempts to extract the data.
Favorite Feature #8: Identifying Content Gaps
What it does: Using citation and grounding query data, you can easily identify content gaps and opportunities for expansion. By analyzing the delta between your successful citations and the broader landscape of grounding queries pulling in competitors, you can determine which content on your site is performing well as an AI source and where there are definitive coverage gaps.
My Favorite Way to Use It: Structuring the Editorial Calendar When my content team needs to update a backlog of legacy blog posts, I cross reference our site’s citation data with the Grounding Queries dashboard. If our “Ultimate Guide to Home Insurance” is failing to generate citations for highly relevant queries, it tells me the data density is likely too low or poorly formatted. I use this insight to issue a targeted editorial brief: strip out the fluffy narrative, add a comparative data table, and reformat the H2s to directly answer the specific questions the AI is trying to verify.
Favorite Feature #9: Bot Analytics and Request Issues
What it does: AI visibility begins at the server level. Clarity allows you to connect your Content Delivery Network (CDN) to monitor exactly how automated scraping agents and AI bots (like OpenAI’s crawler, Anthropic, or Bingbot) are interacting with your site infrastructure. It provides a Request Status Breakdown, showing the volume of successful crawls versus request failures, blocked requests, and overall crawl issues.
My Favorite Way to Use It: Technical SEO for the AI Web If I notice a sudden drop in citations across a site, I immediately check the Bot Analytics dashboard. If I see a massive spike in blocked requests and 403 Forbidden errors specifically targeting AI user agents, I know what went wrong. It usually means a recent security update from the IT department accidentally blacklisted the IP ranges used by major LLM crawlers. I can take this data straight to the DevOps team to prove the security settings are literally blocking the AI from reading the site. Once they unblock the paths, citation rates recover.
Getting Started
If you are ready to stop guessing and start seeing exactly how both human users and artificial intelligence systems interact with your content, getting started with Microsoft Clarity is incredibly simple. You can head over to clarity.microsoft.com to create your account. You can sign up in seconds using an existing Microsoft, Google, or Facebook account. Once you are logged in, you just need to drop the tracking snippet onto your website or connect it directly through Google Tag Manager. Data usually begins populating within a couple of hours, allowing you to immediately start optimizing your digital strategy with real behavioral insights. Let me know how you like it!